Data
The data was collected through a survey that was shared with friends and friends of friends. Respondents were asked to list the order of who would be told first to last depending on the type of news or content they consume. As such, a pattern in the chain of communication will be illustrated which nudges a deeper understanding of the dynamics of interpersonal relationships.
Introduction
Tell-Trails is a project that aims to explore the chain of communication concerning the news or content we consume and how we share them with the people who are typically constant in our lives. The trail will vary from person to person as they are subjective to the different notions and contexts of the news and the fundamentals of each persons' relationships with the people around them. The arbitrariness in the responses will present an insight into the dynamics of the different profiles of relationships through recognising patterns. Some profiles frequent at the start of the trail while others appear to frequent at the end. The project does not aim to rationalise the pattern but rather leaves an open-ended observation of how we communicate as social beings.
Data Visualisation
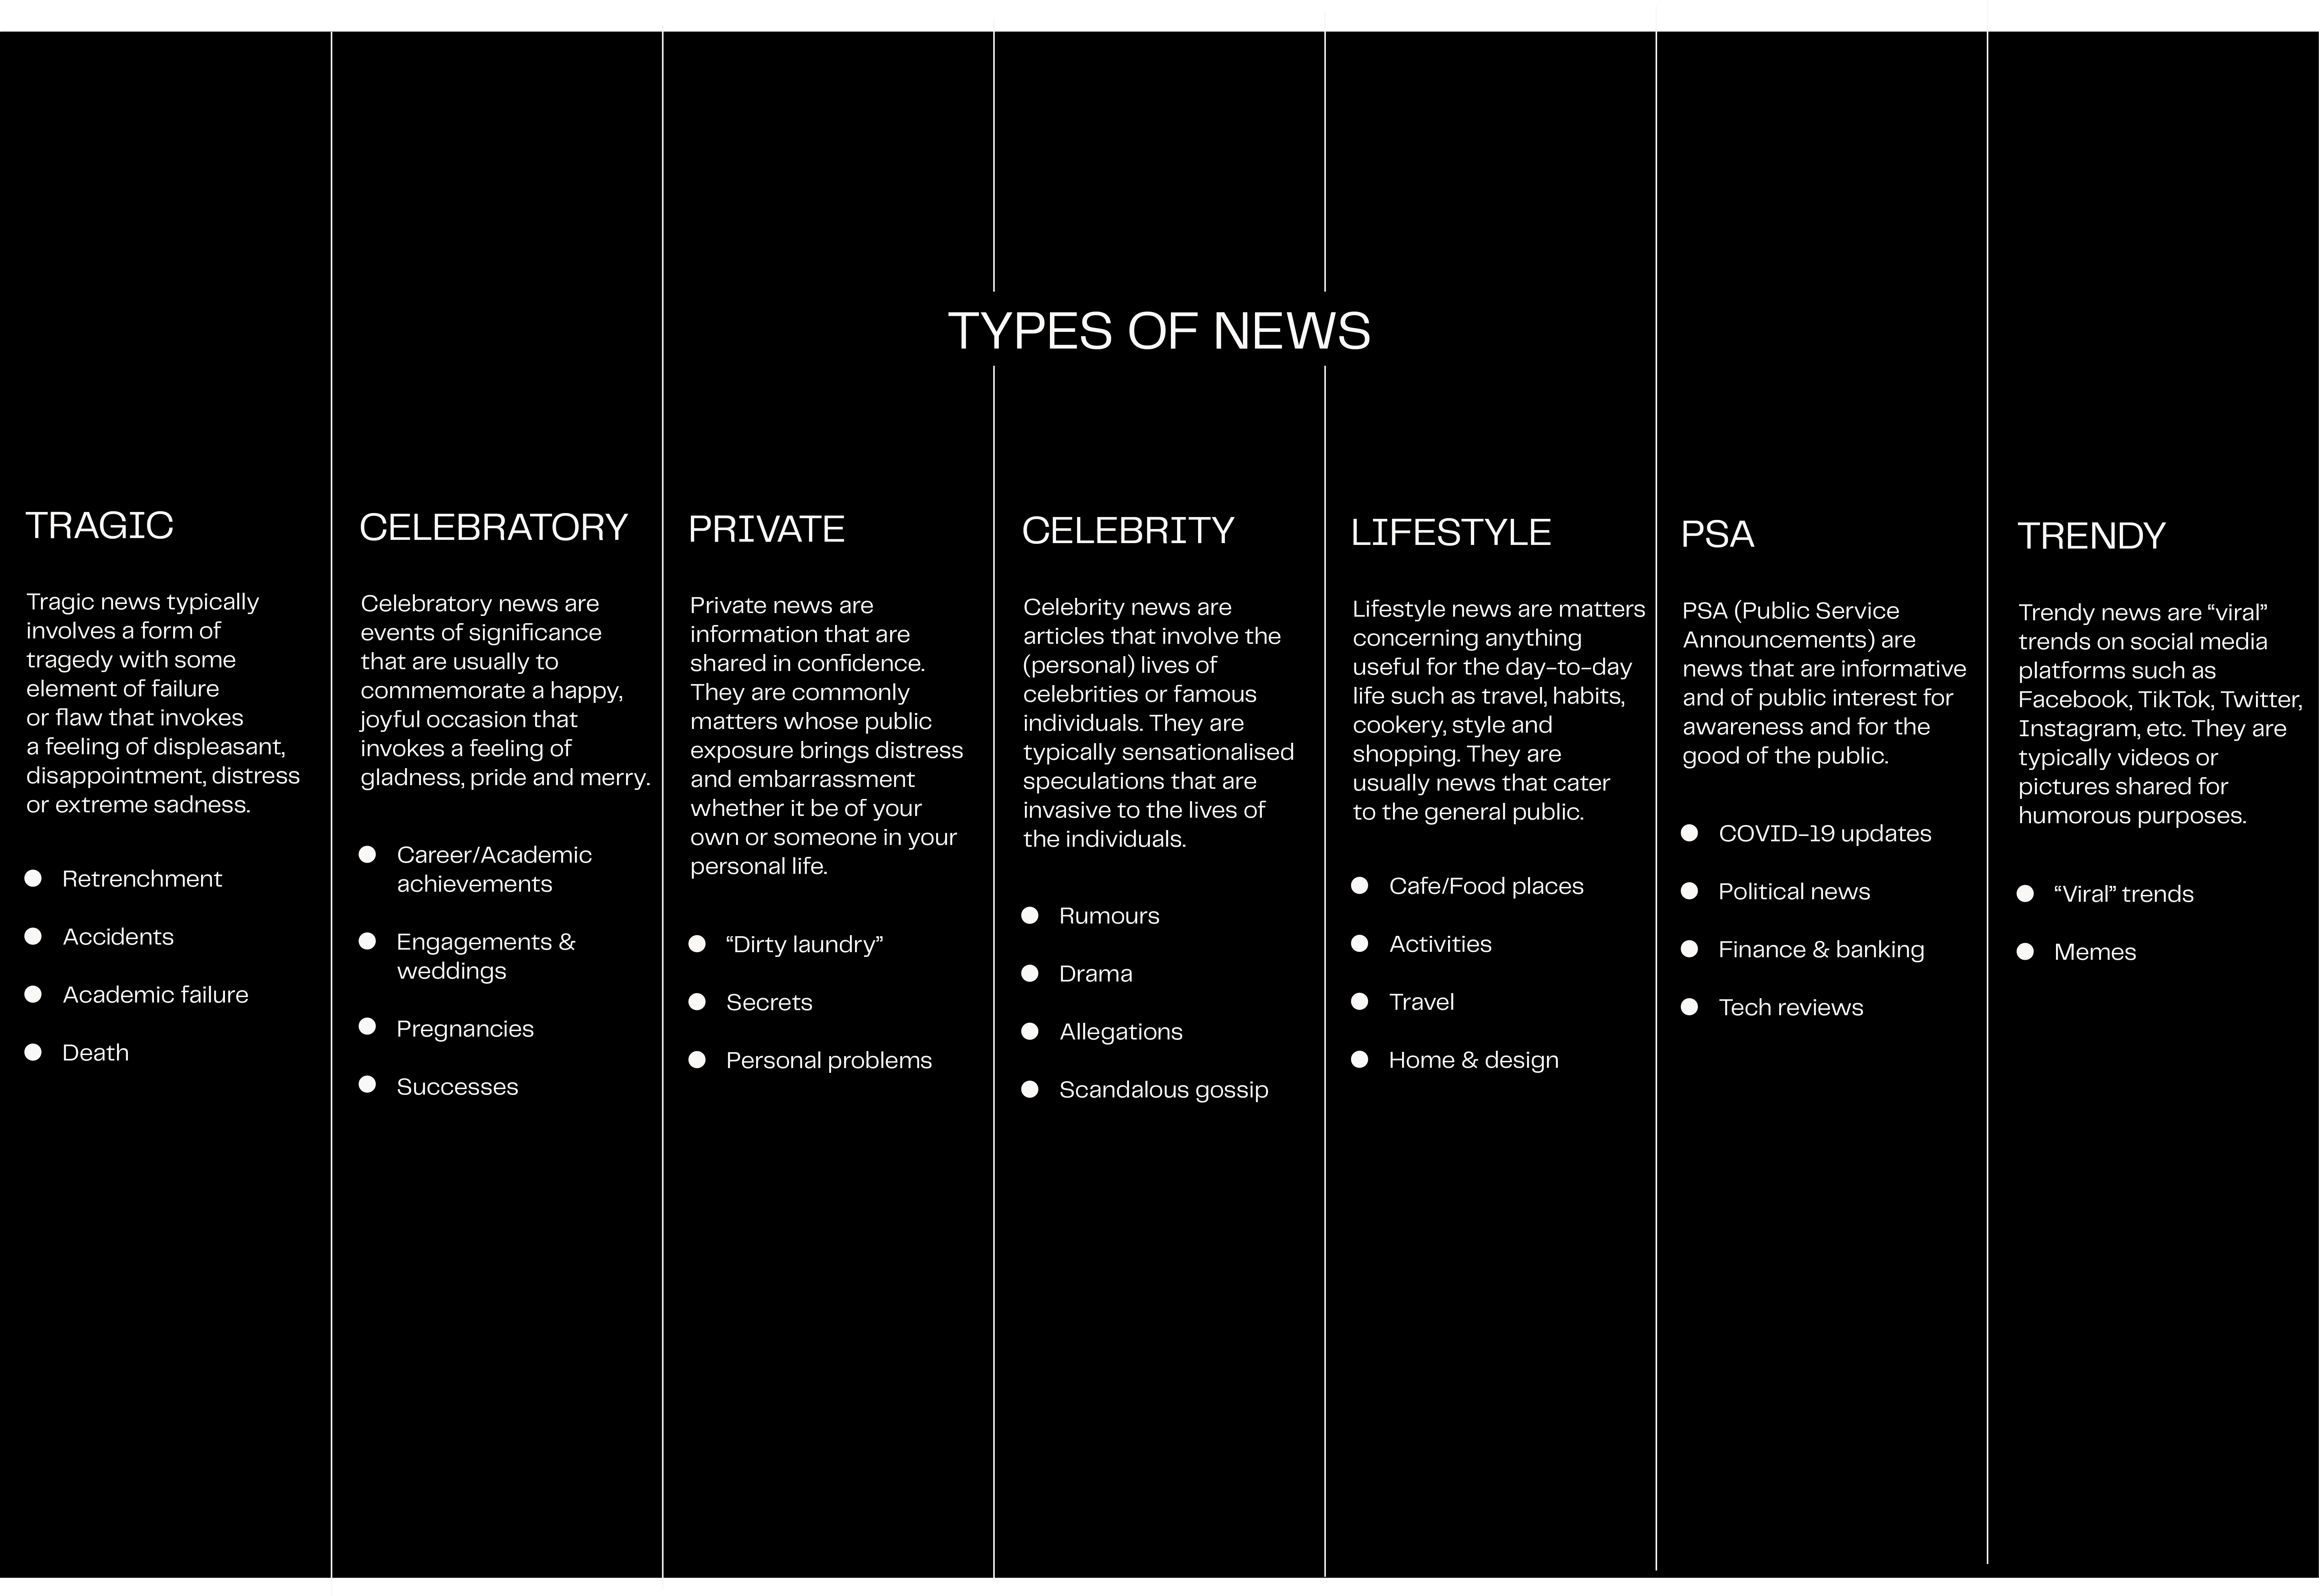
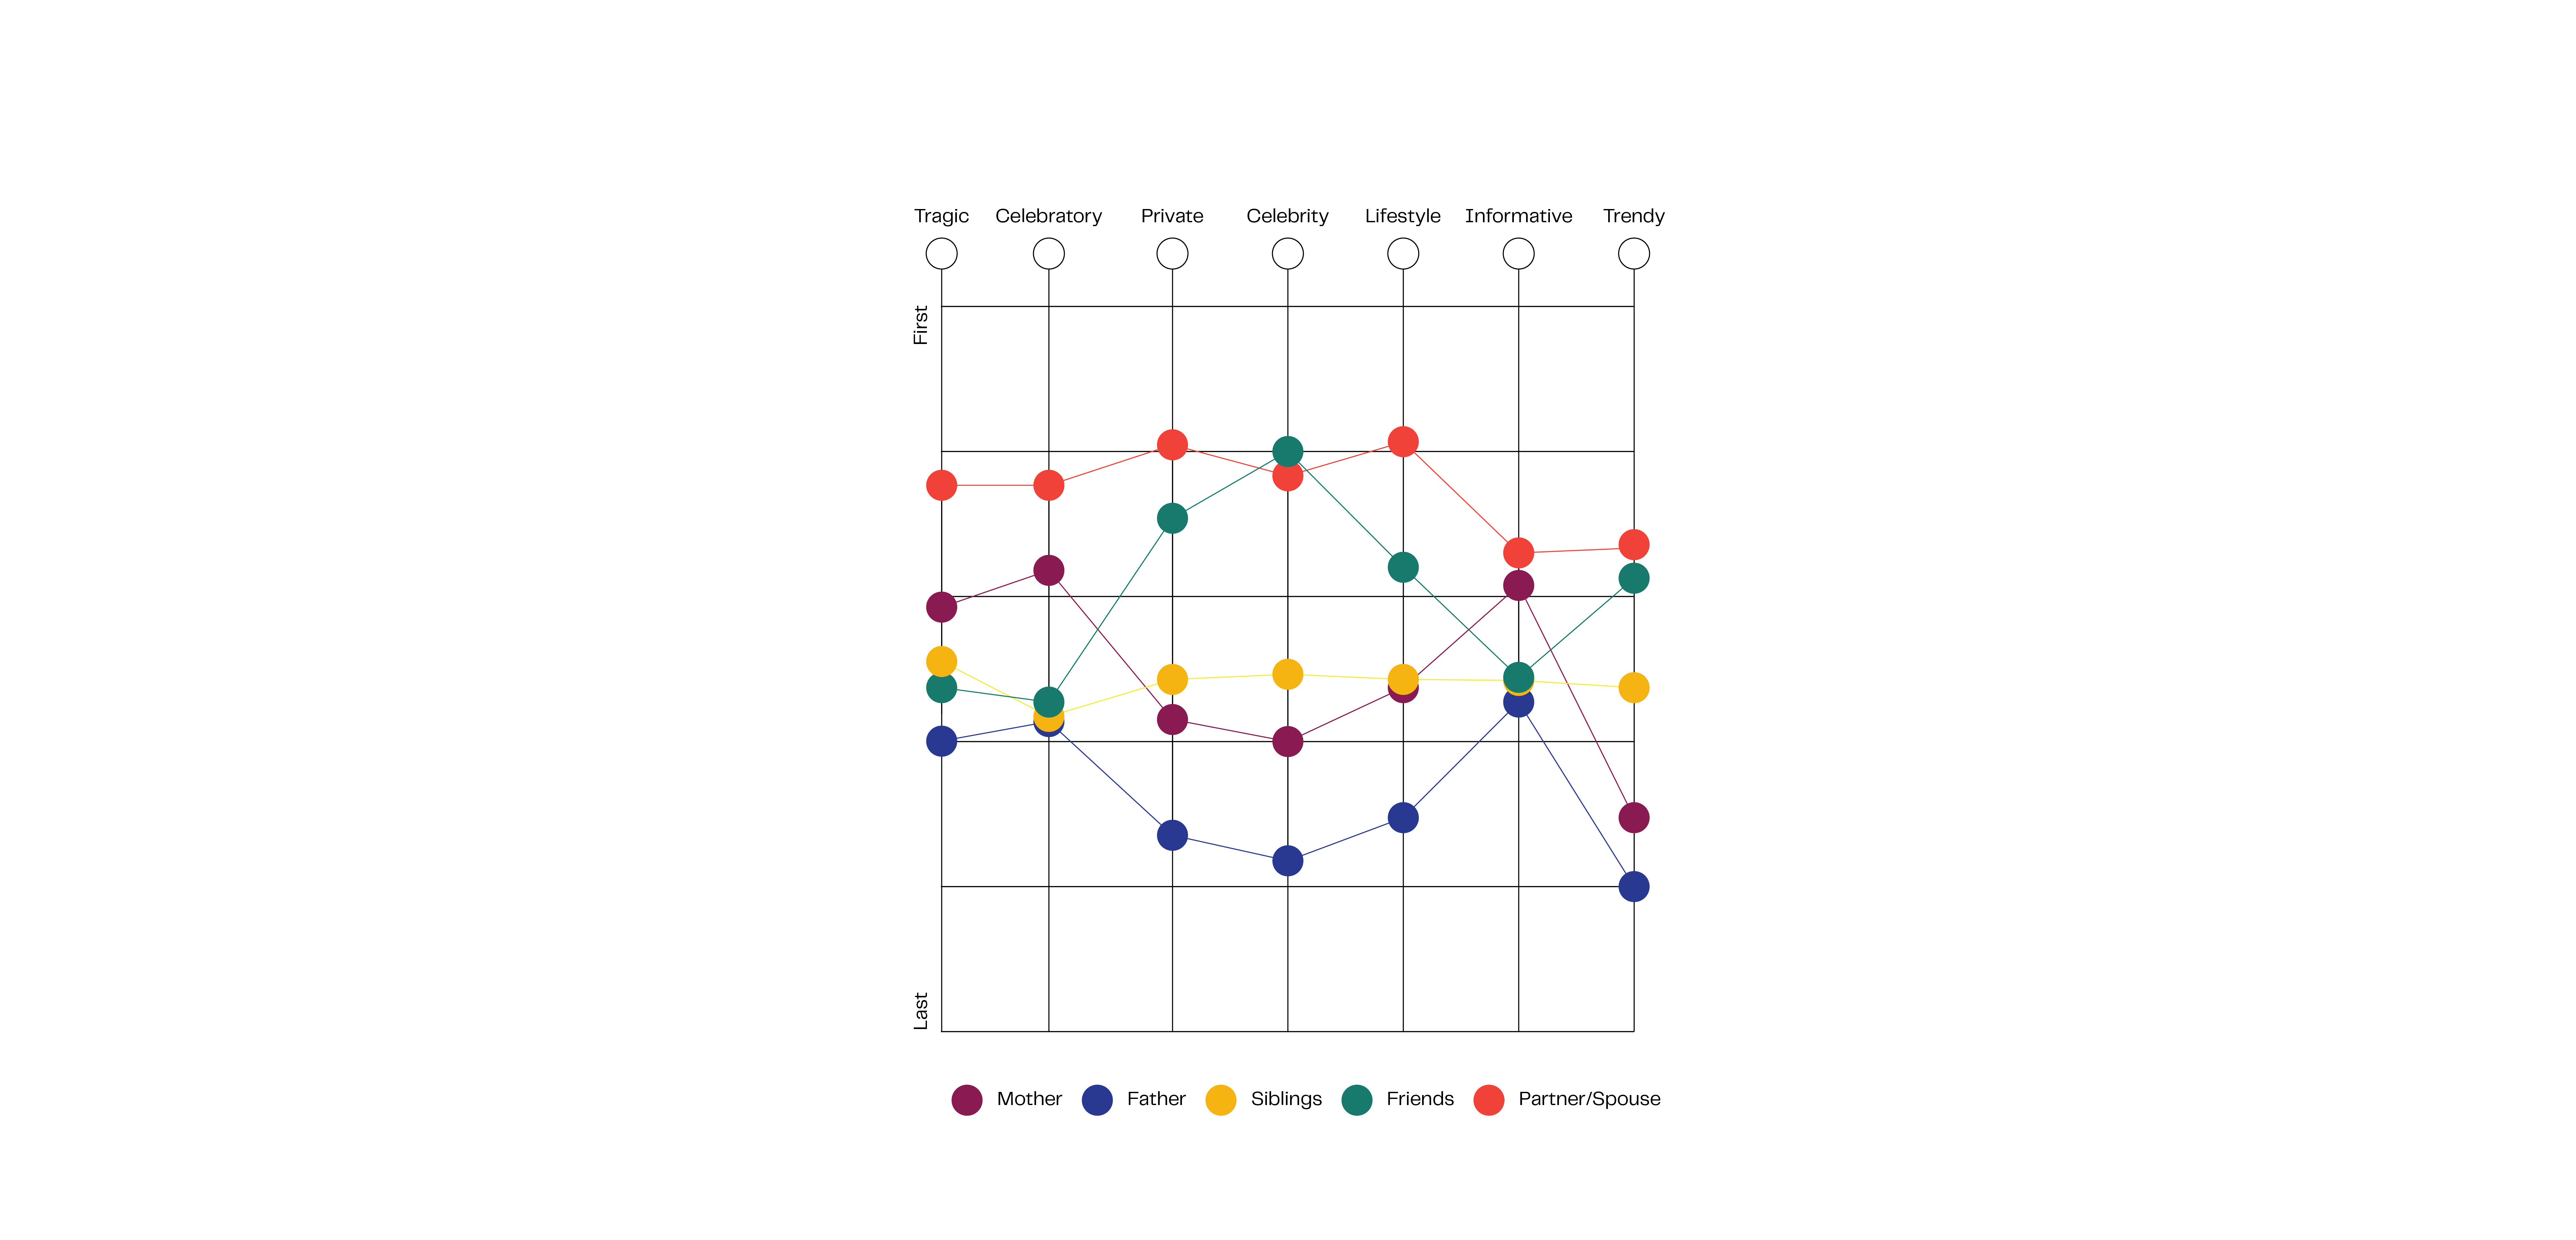
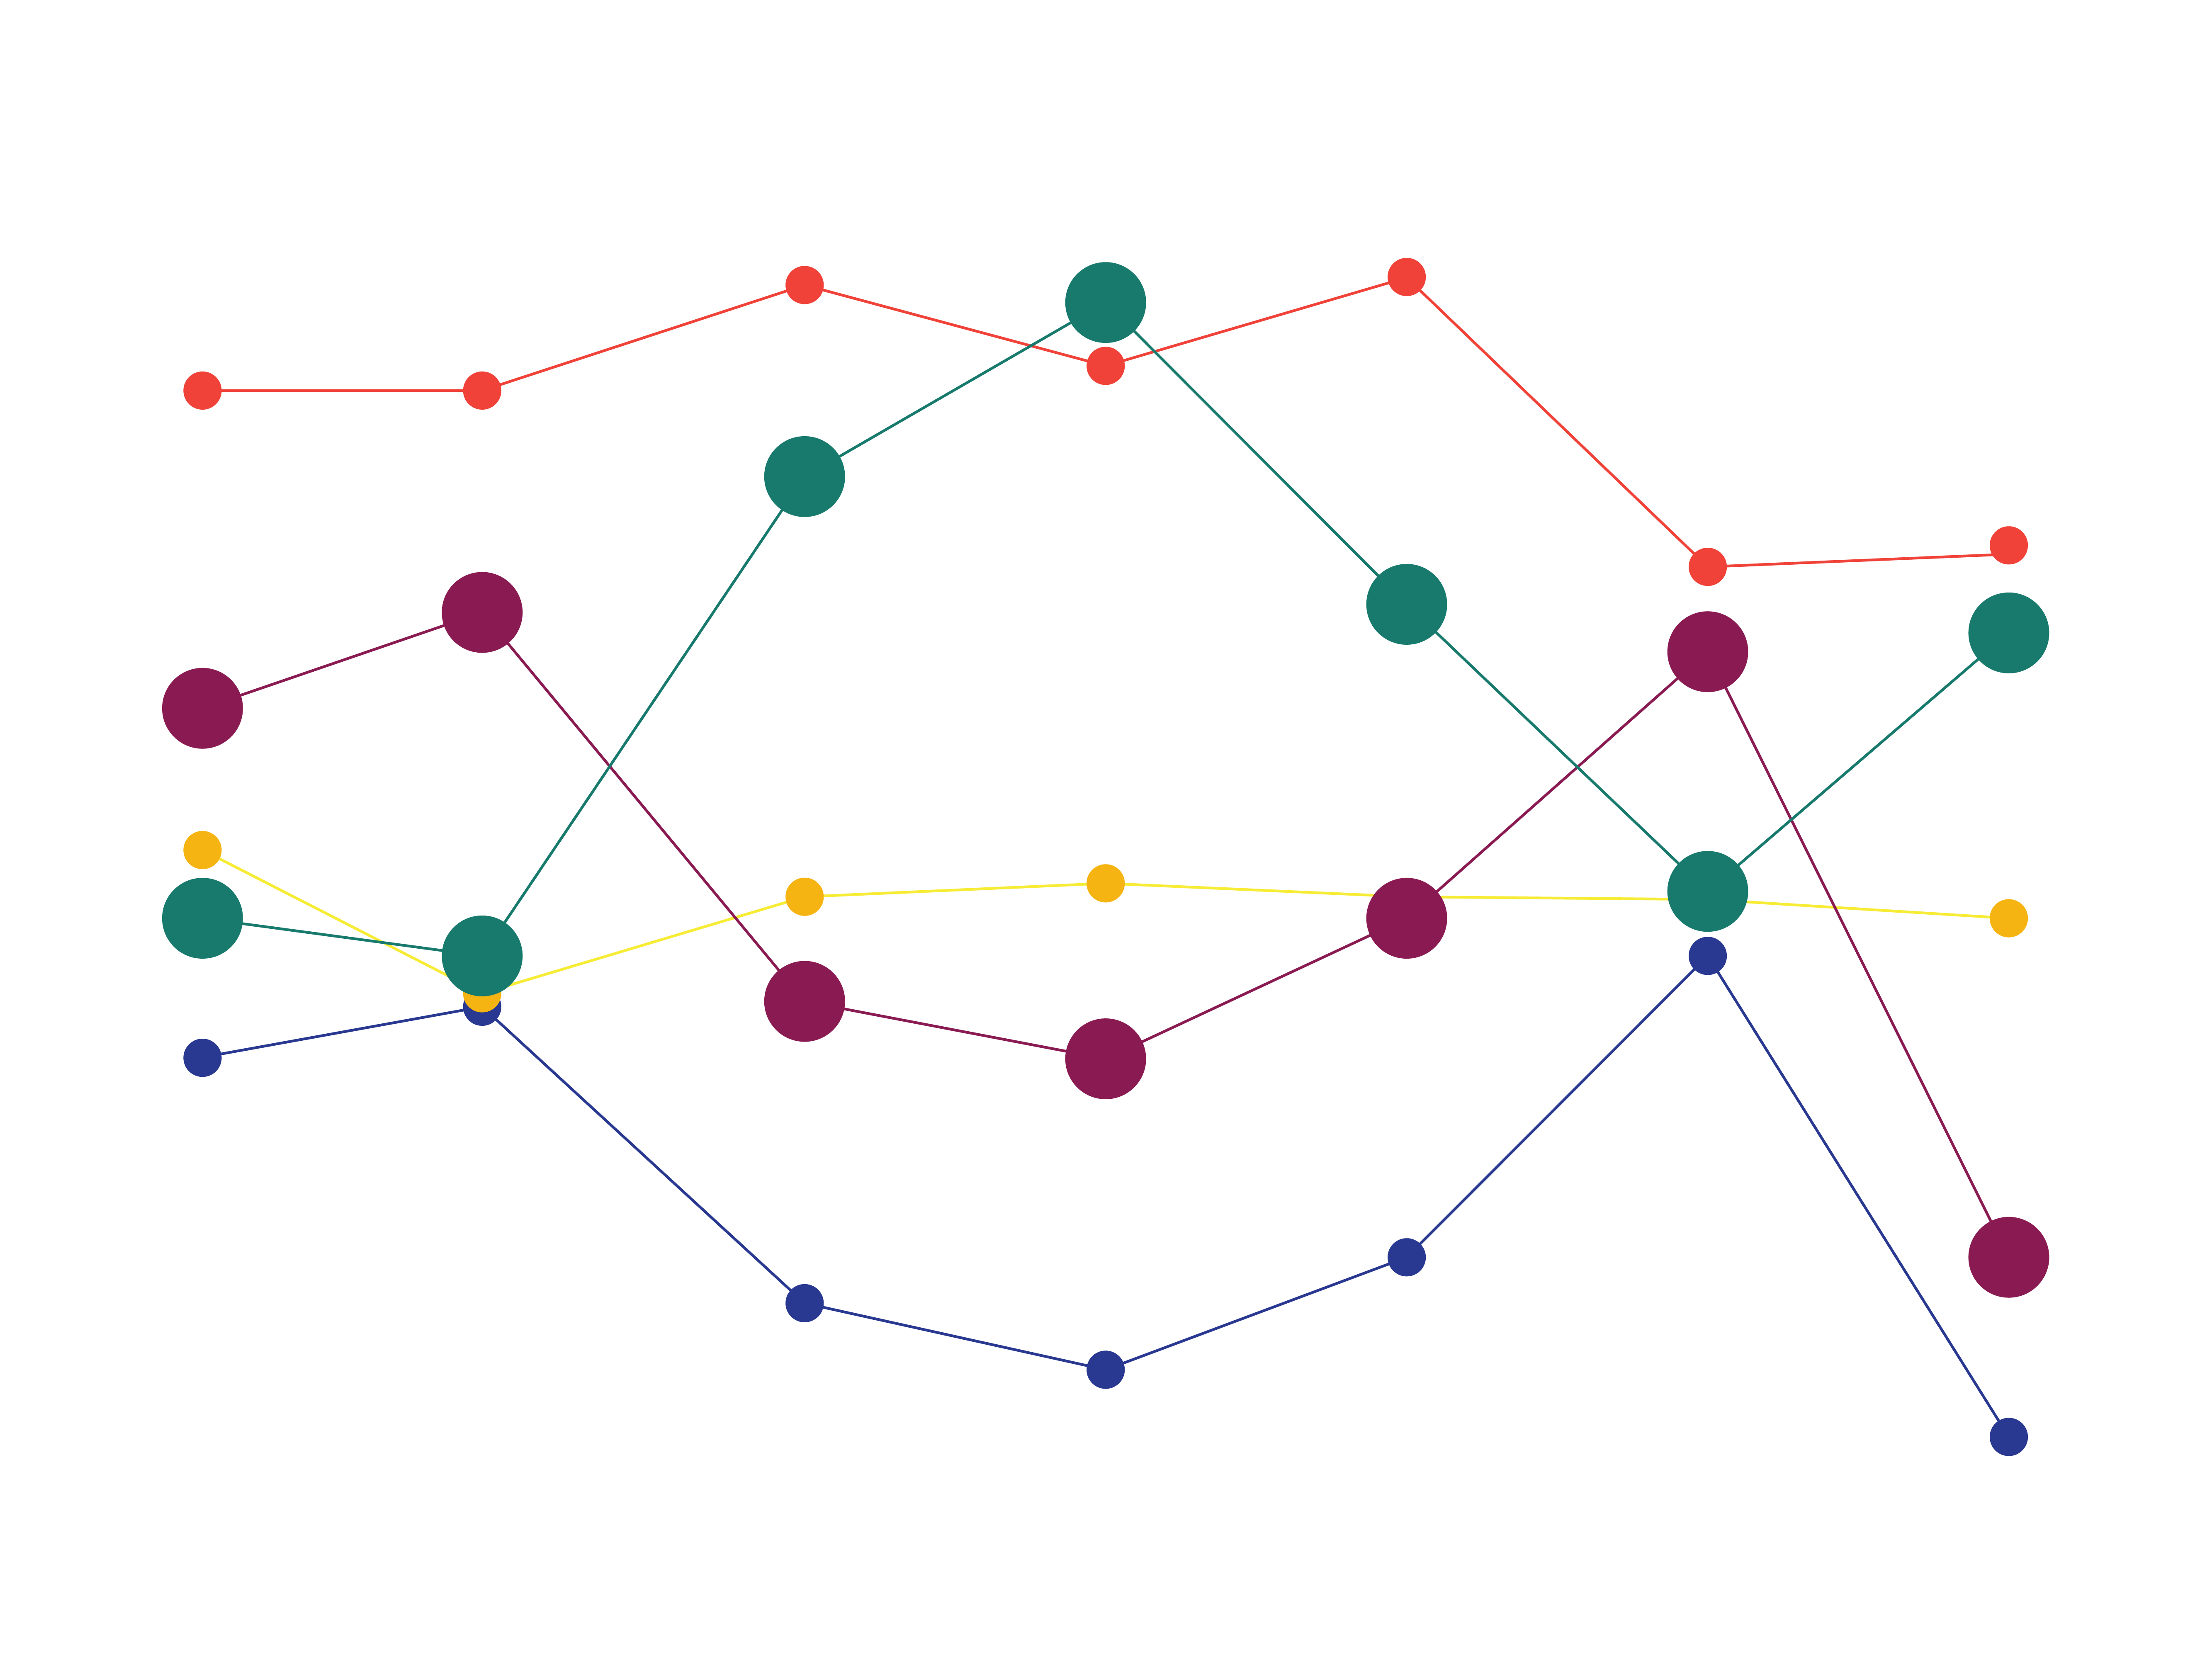
The data was collected through a Google Forms survey that was shared with friends and friends of friends. Respondents were asked to list the order of who would be told first to last depending on the type of news or content they consume. There are two main categories to the data – news and relationships. The types of news are classified into different sub-categories; tragic, celebratory, private, celebrity, lifestyle, PSA (Public Service Announcement) and trendy; and the relationships are profiled through mothers, fathers, siblings, friends and partners. From each category of news, the collated responses were then tabulated and ranked according to the different relationship profiles and their probability of occurrence – first to last. The data is then presented through a line graph as there is a series of data points to be presented and to also illustrate a trail in the chain of communication.
X-axis: Types of news
Y-axis: The probability of occurrence according to relationship profiles
Findings
The ranking of the probability of occurrence was calculated through a technique of weighting the average of the data. This technique is common for survey research that involves assigning a multiplier to data to give it more or less weight to find an average mean for comparison. In the case of this project, values (the relationship profiles) that are ranked first are given the multiplier x5 as it holds more weight than the values ranked last, given the multiplier x1.
Ranked 1st = x 5
Ranked 2nd = x 4
Ranked 3rd = x 3
Ranked 4th = x 2
Ranked last = x 1
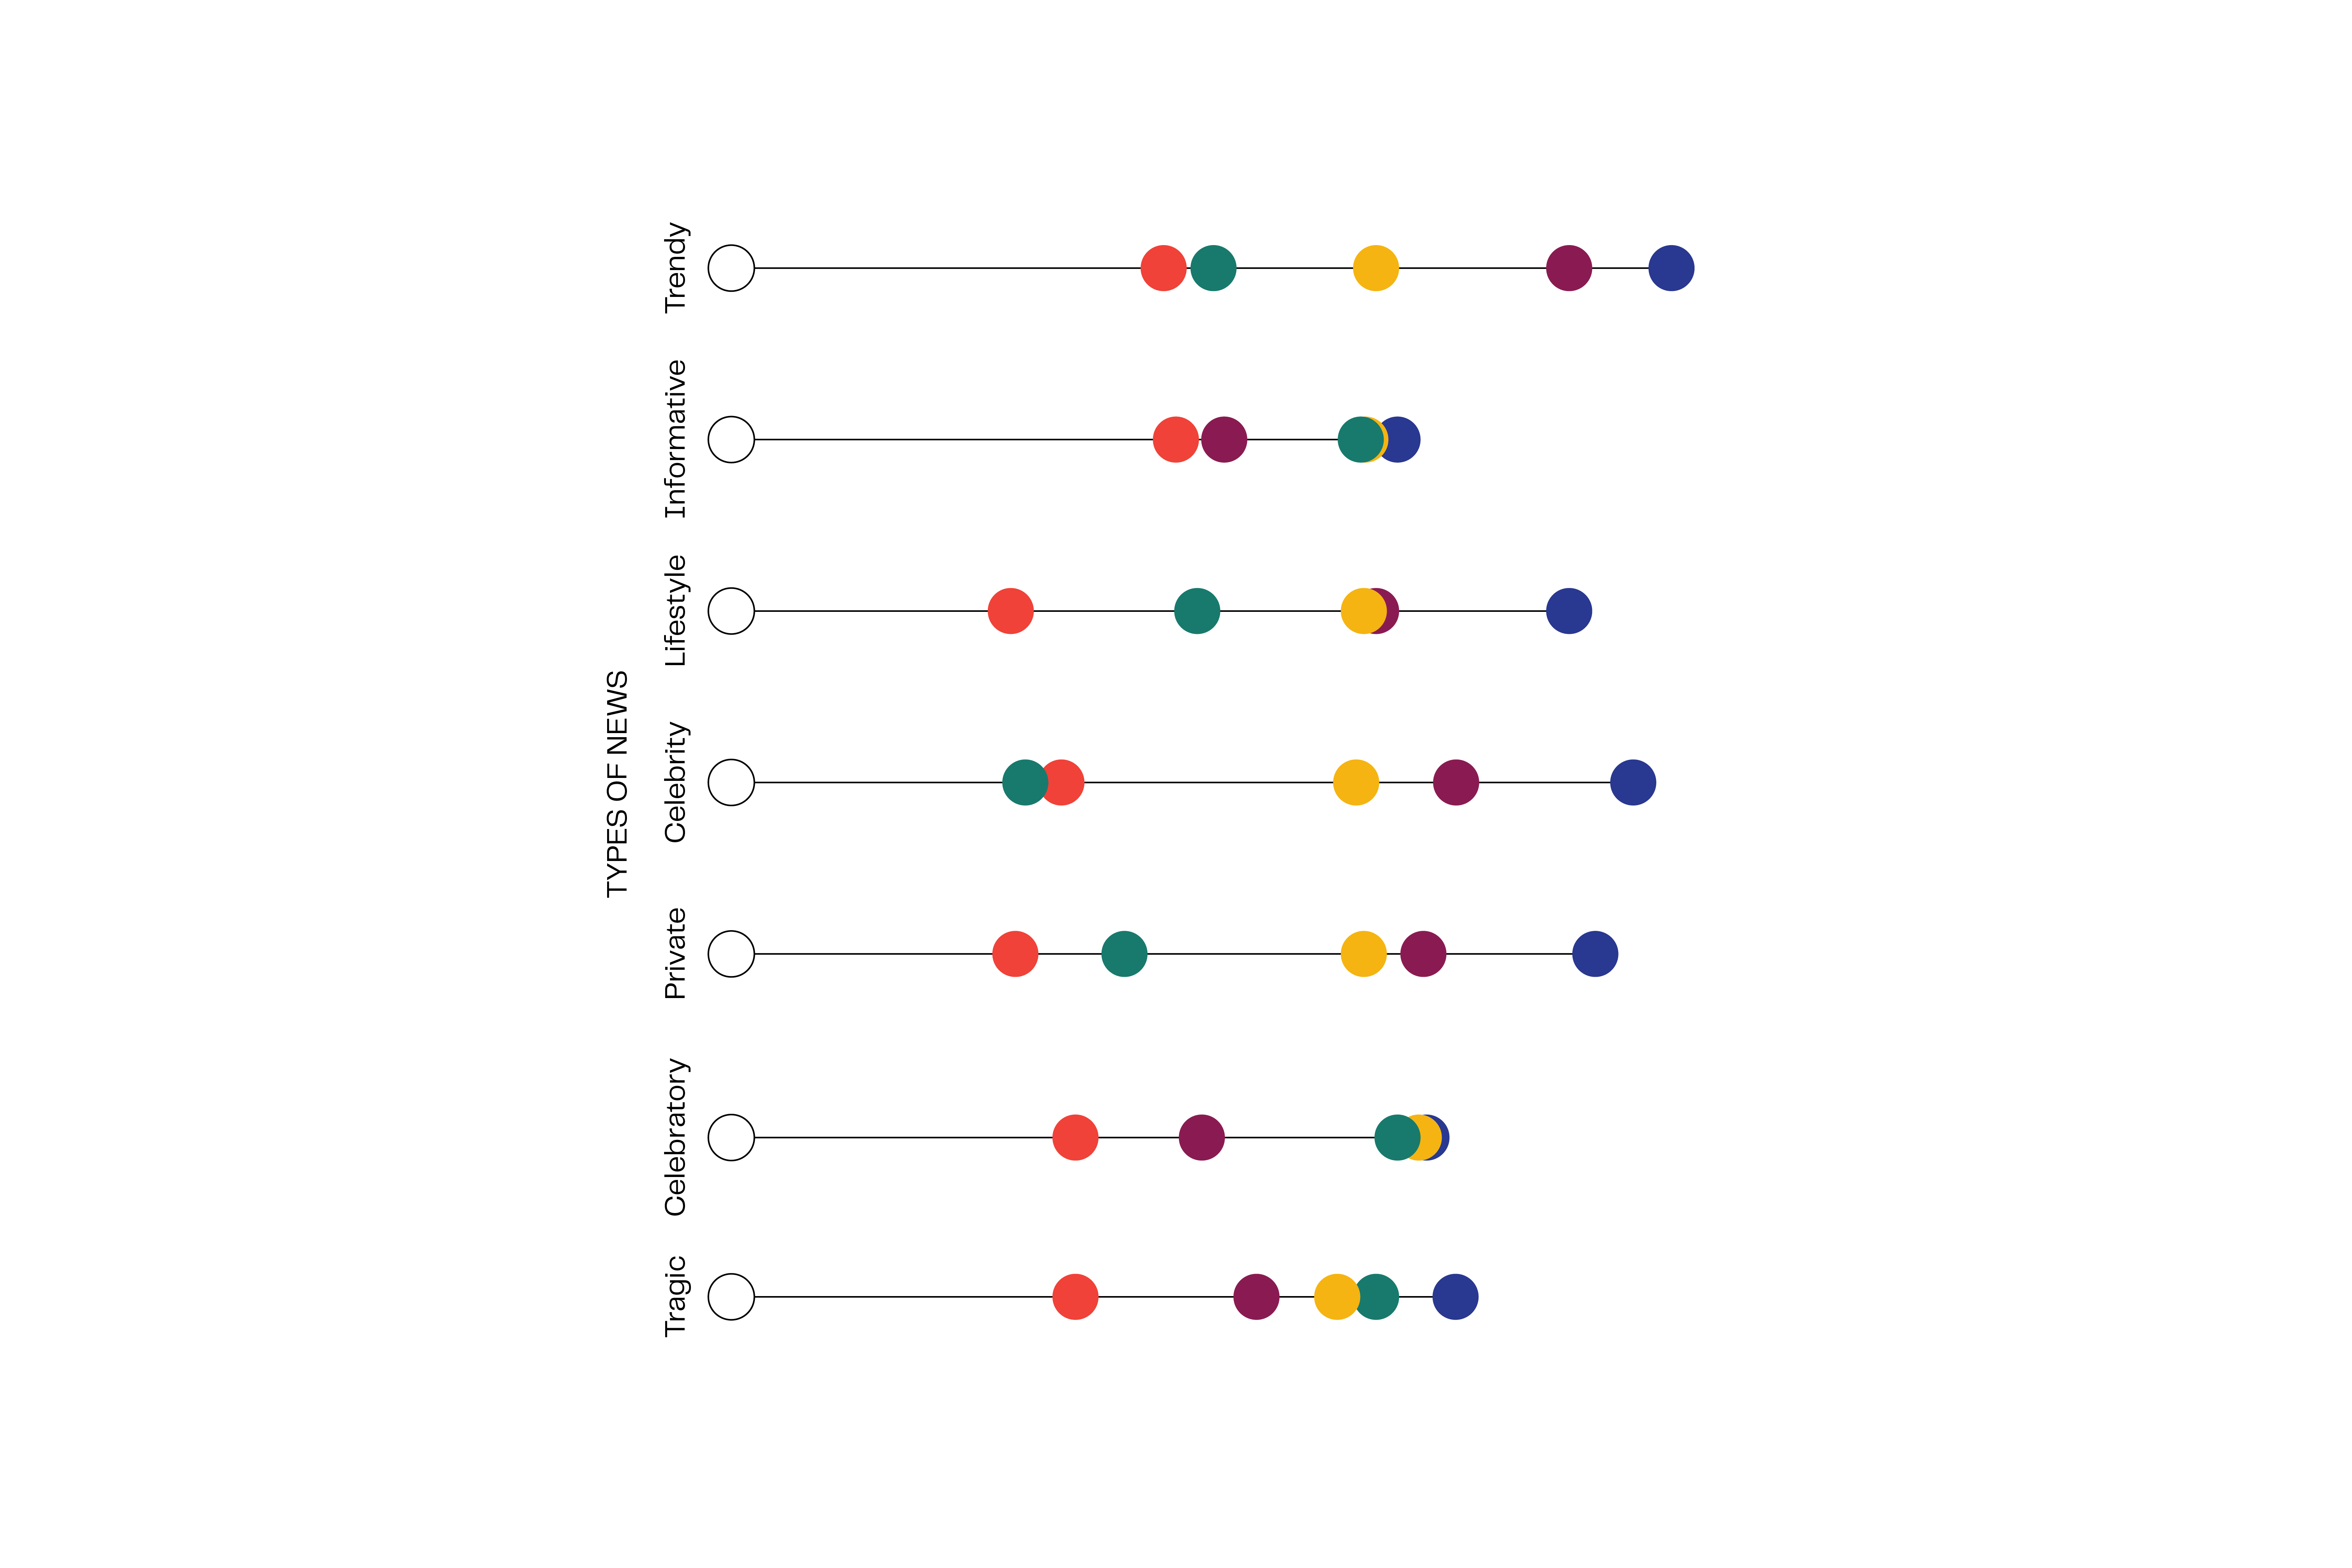
From this technique, the values generated are then re-ordered from first to last with the biggest value ranking first – as that indicates a higher probability of occurrence in ranking first – and the smallest value ranking last – as that indicates its probability of occurrence in ranking last. What could be found from the Tell-Trails survey through the graph is that the relationship profile most likely ranked first is “Partner/Spouse” and the most likely ranked last is “Father”.

Insights
From the graph, it can be observed that the relationship profile most likely ranked first is “Partner/Spouse” and the most likely ranked last is “Father” across the types of news, with the exception of celebrity news where “Friends” were ranked first. This observation leads us to question our dynamics of communication in romantic relationships (“Partner/Spouse”), platonic relationships (“Friends”) and familial relationships (“Mother”, “Father”, “Siblings”). It appears that there is a higher sense of urgency in sharing news or information in romantic relationships as compared to familial relationships, which proposes a kind of irony as it is stereotypical or expected for family to come first in societal culture. Instead, this project illustrates how strangers that we choose to welcome into our lives could rank higher in urgency.
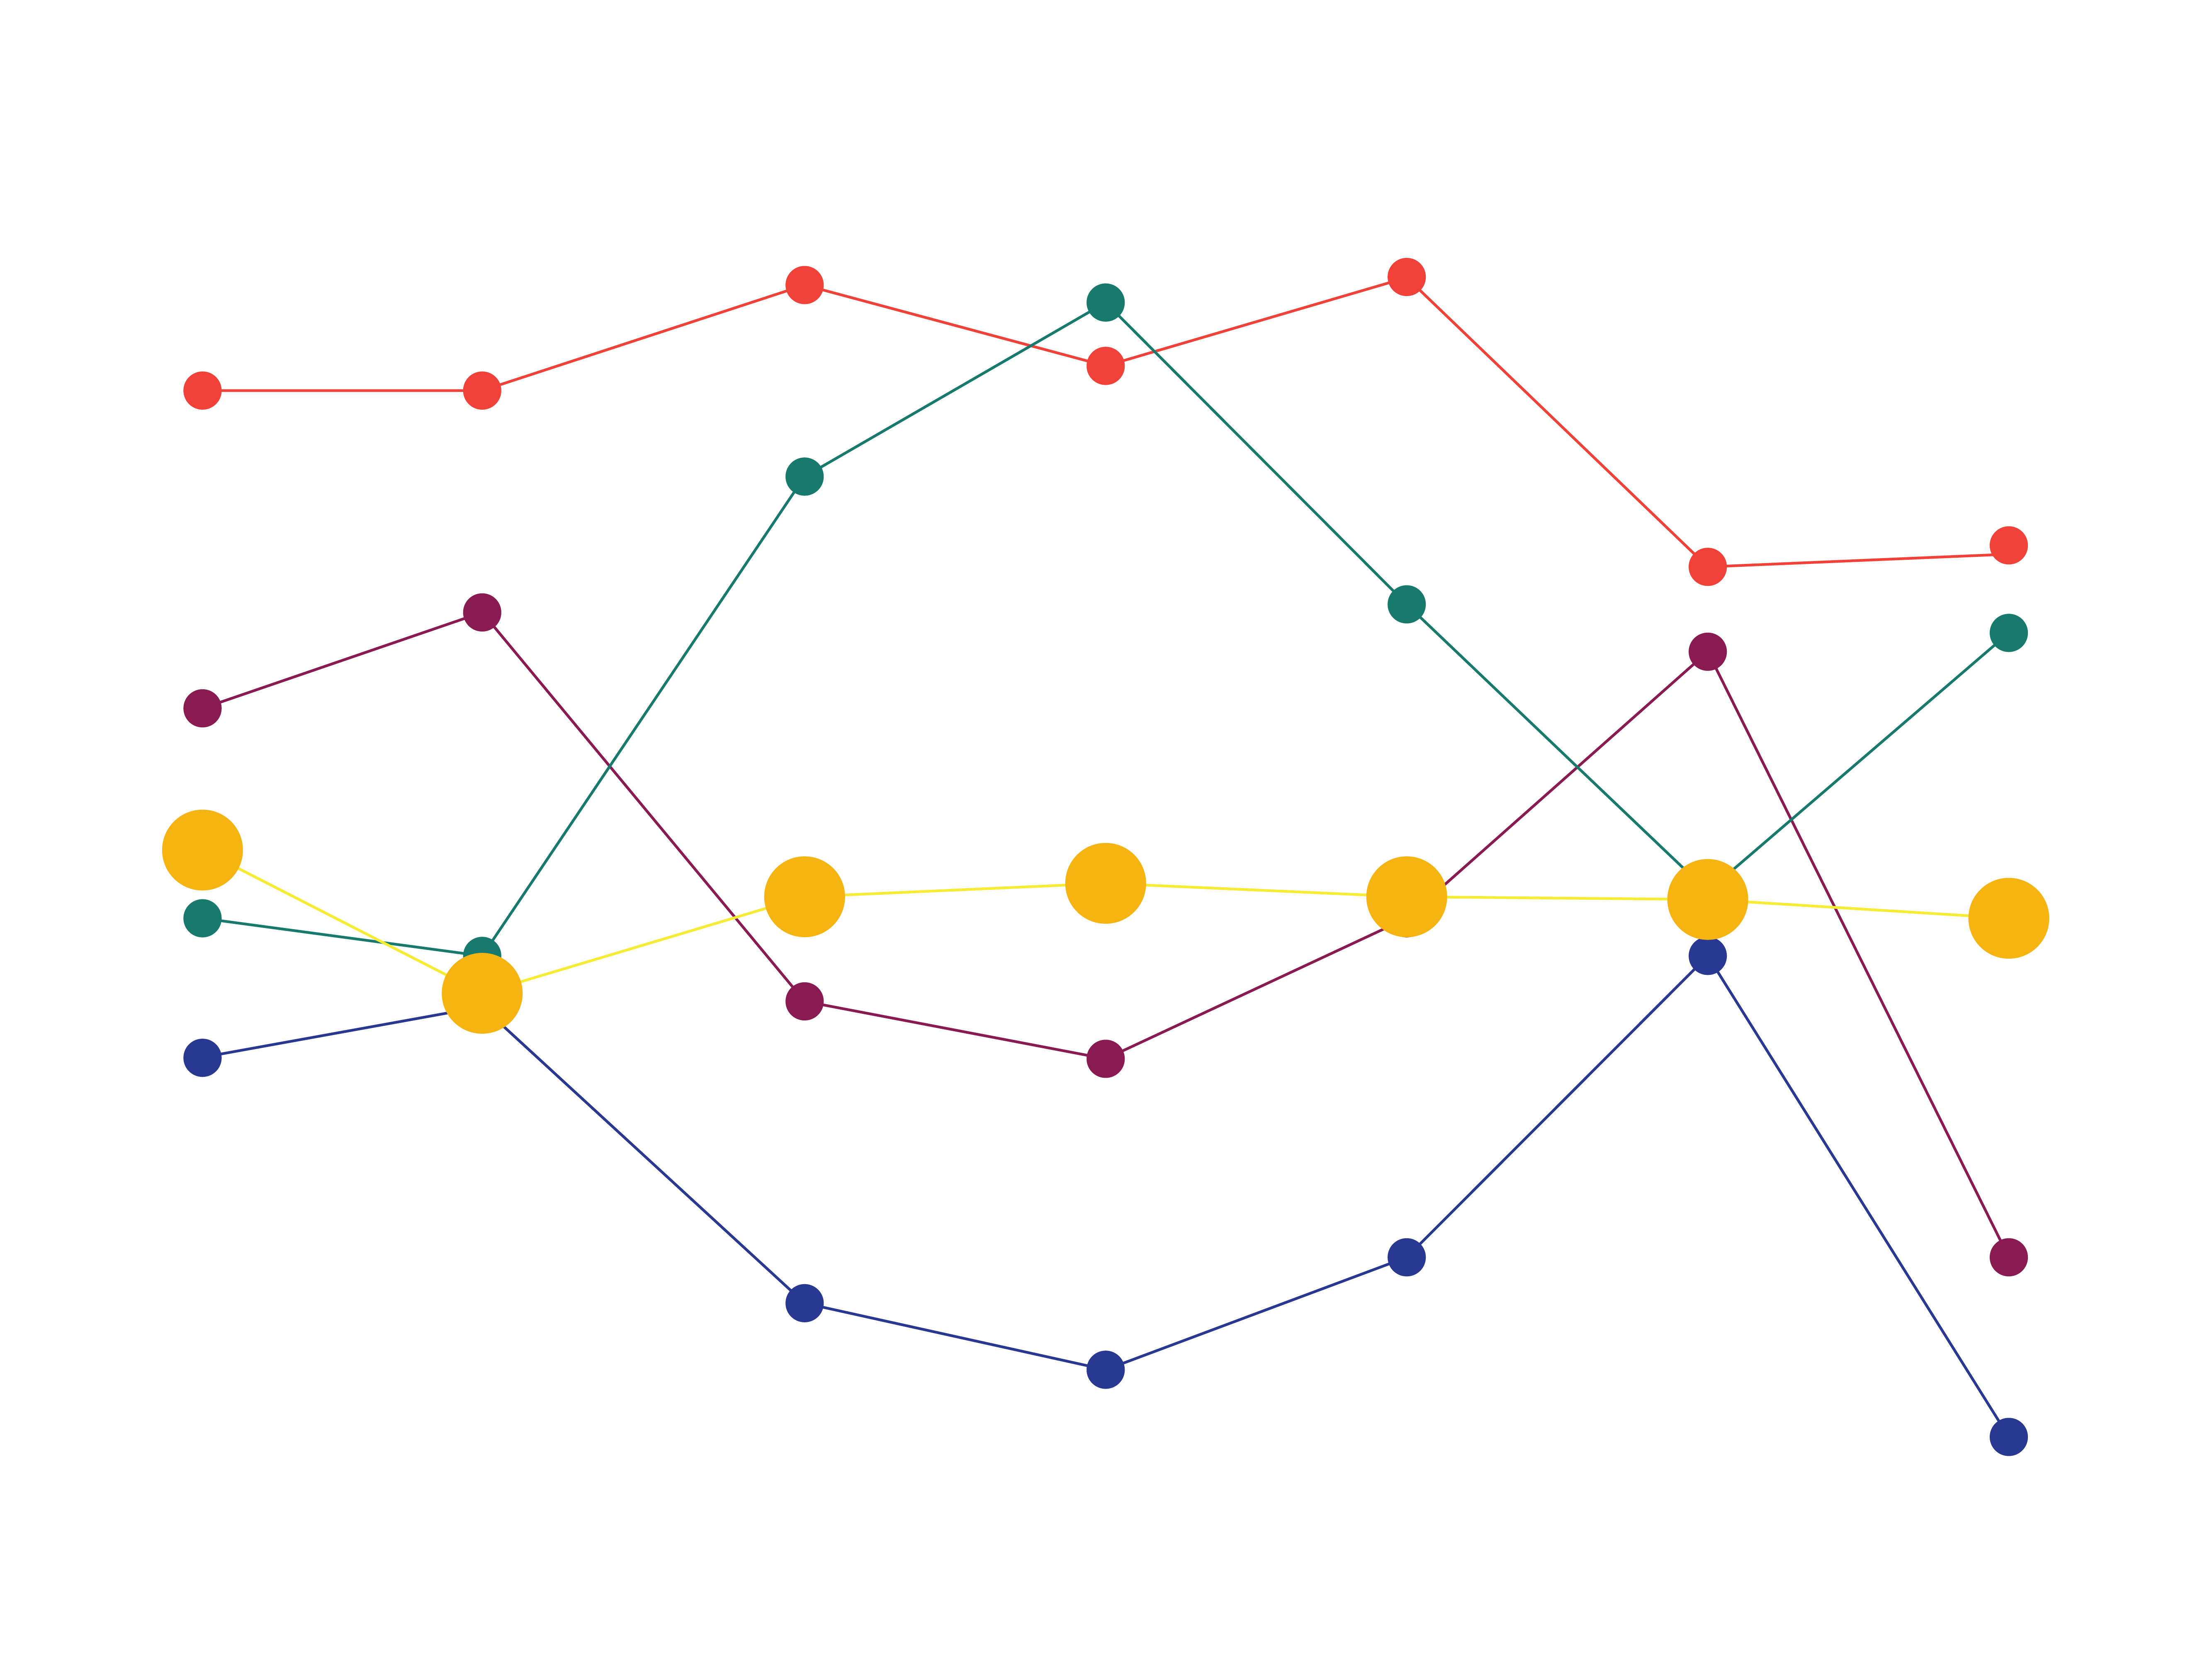
Another observation that could be made is that the individual line graphs for each relationship profile can be relatively stable and linear to having more drastic “jumps”. The line graph for “Siblings” is almost linear, which can suggest that they are the most neutral party in the chain of communication, where they are not likely the first to be told nor the last.
Conclusion
Although we consume a myriad of information every day that could potentially morph into newer and more substantial information, there is a pattern in how we verbalise or share them with the people around us. The patterns discovered in this project need not be rationalised as interpersonal relationships are arbitrary. Therefore, the results need not be conclusive. This project aims to explore that chain of communication in hopes to discover a deeper understanding of the dynamics of interpersonal relationships.
